MGFIT-idl
MGFIT-idl - IDL/GDL Library for Least-Squares Minimization Genetic Algorithm Fitting

Description
The MGFIT is an Interactive Data Language (IDL)/GNU Data Language (GDL) Library developed to fit multiple Gaussian functions to a list of emission (or absorption) lines using a least-squares minimization technique and a random walk method in three-dimensional locations of the specified lines, namely line peak, line width, and wavelength shift. It uses the MPFIT IDL Library (MINPACK-1 Least Squares Fitting; Markwardt 2009), which performs Levenberg-Marquardt least-squares minimization, to estimate the seed values required for initializing the three-dimensional coordination of each line in the first iteration. It then uses a random walk method optimized using a genetic algorithm originally evolved from the early version of the Fortran program ALFA (Automated Line Fitting Algorithm; Wesson 2016) to determine the best fitting values of the specified lines. The continuum curve is determined and subtracted before the line identification and flux measurements. It quantifies the white noise of the spectrum, which is then utilized to estimate uncertainties of fitted lines using the signal-dependent noise model of least-squares Gaussian fitting (Lenz & Ayres 1992) built on the work of Landman, Roussel-Dupre, and Tanigawa (1982).
Installation
Dependent IDL Packages
This package requires the following packages:
To get this package with all the dependent packages, you can simply use git command as follows:
git clone --recursive https://github.com/mgfit/MGFIT-idl
Installation in IDL
- To install the MGFIT IDL library in the Interactive Data Language (IDL), you need to add the path of this package directory to your IDL path. For more information about the path management in IDL, read the tips for customizing IDL program path provided by Harris Geospatial Solutions or the IDL library installation note by David Fanning in the Coyote IDL Library.
- This package requires IDL version 7.1 or later.
Installation in GDL
You can install the GNU Data Language (GDL) if you do not have it on your machine:
Linux (Fedora):
sudo dnf install gdl
Linux (Ubuntu):
sudo apt-get install gnudatalanguage
OS X (brew):
brew tap brewsci/science
brew install gnudatalanguage
OS X (macports):
sudo port selfupdate
sudo port upgrade libtool
sudo port install gnudatalanguage
Windows: You can use the GNU Data Language for Win32 (Unofficial Version) or you can compile the GitHub source using Visual Studio 2015 as shown in appveyor.yml.
To install the MGFIT library in GDL, you need to add the path of this package directory to your .gdl_startup file in your home directory:
!PATH=!PATH + ':/home/MGFIT-idl/pro/'
!PATH=!PATH + ':/home/MGFIT-idl/externals/astron/pro/'
!PATH=!PATH + ':/home/MGFIT-idl/externals/coyote/pro/'
!PATH=!PATH + ':/home/MGFIT-idl/externals/coyote/public/'
!PATH=!PATH + ':/home/MGFIT-idl/externals/mpfit/'
You may also need to set GDL_STARTUP if you have not done in .bashrc (bash):
export GDL_STARTUP=~/.gdl_startup
or in .tcshrc (cshrc):
setenv GDL_STARTUP ~/.gdl_startup
This package requires GDL version 0.9.8 or later.
How to Use
The Documentation of the IDL functions provides in detail in the API Documentation (mgfit.github.io/MGFIT-idl/doc). This IDL library fit multiple Gaussian functions to a list of emission lines in the given input spectrum.
You need to load the line list database:
base_dir = file_dirname(file_dirname((routine_info('$MAIN$', /source)).path))
data_dir = ['data']
fits_file = filepath('linedata.fits', root_dir=base_dir, subdir=data_dir )
strongline_data=read_stronglines(fits_file)
deepline_data=read_deeplines(fits_file)
also load your spectrum arrays: wavelength array, and flux array (see examples):
input_dir = ['examples','inputs']
input_file = filepath('spectrum.txt', root_dir=base_dir, subdir=input_dir )
read1dspecascii, input_file, wavel, flux
and define the output paths:
output_dir = ['examples','outputs']
image_dir = ['examples','images']
image_output_path = filepath('', root_dir=base_dir, subdir=image_dir )
output_path = filepath('', root_dir=base_dir, subdir=output_dir )
You need to specify the genetic algorithm settings:
popsize=30.
pressure=0.3
generations=500.
and use the appropriate fitting settings such as the wavelength interval, the redshift, and the spectral resolution:
interval_wavelength=500
redshift_initial = 1.0
redshift_tolerance=0.001
fwhm_initial=1.0
fwhm_tolerance=1.4
fwhm_min=0.1
fwhm_max=1.8
Now you run the MGFIT main function as follows:
emissionlines = mgfit_detect_lines(wavel, flux, deepline_data, strongline_data, $
                                   popsize=popsize, pressure=pressure, $
                                   generations=generations, $
                                   interval_wavelength=interval_wavelength, $
                                   redshift_initial=redshift_initial, $
                                   redshift_tolerance=redshift_tolerance, $
                                   fwhm_initial=fwhm_initial, $
                                   fwhm_tolerance=fwhm_tolerance, $
                                   fwhm_min=fwhm_min, fwhm_max=fwhm_max, $
                                   image_output_path=image_output_path, output_path=output_path)
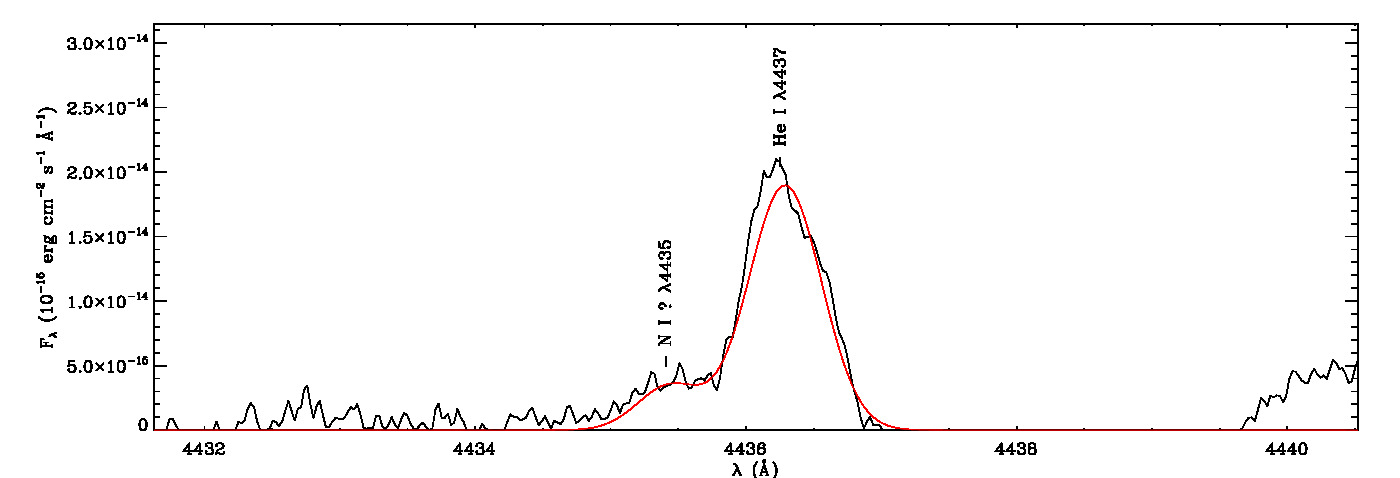
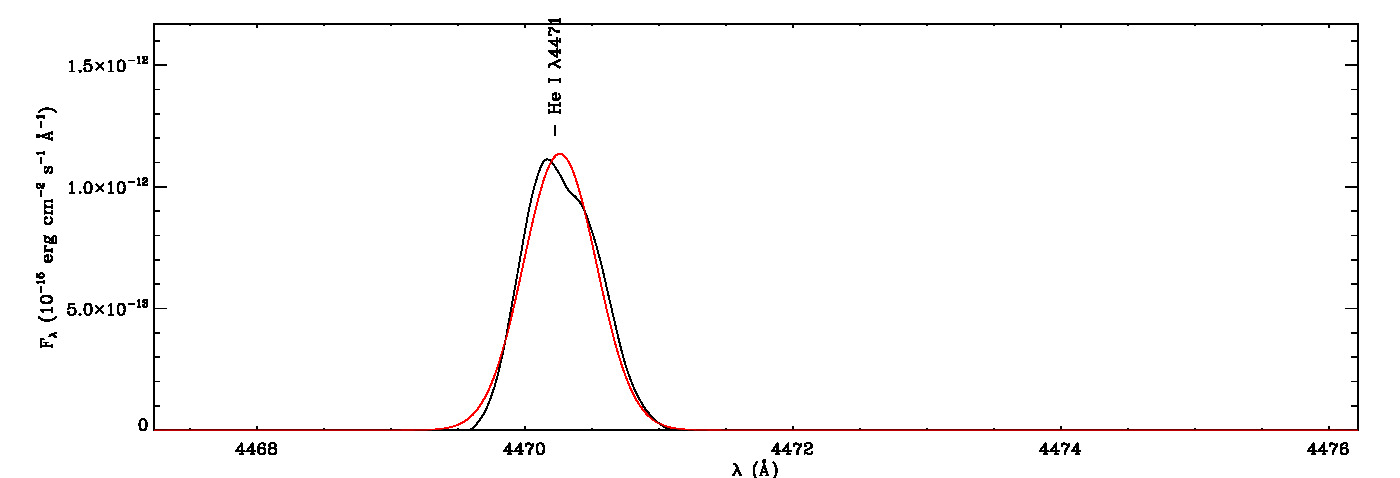
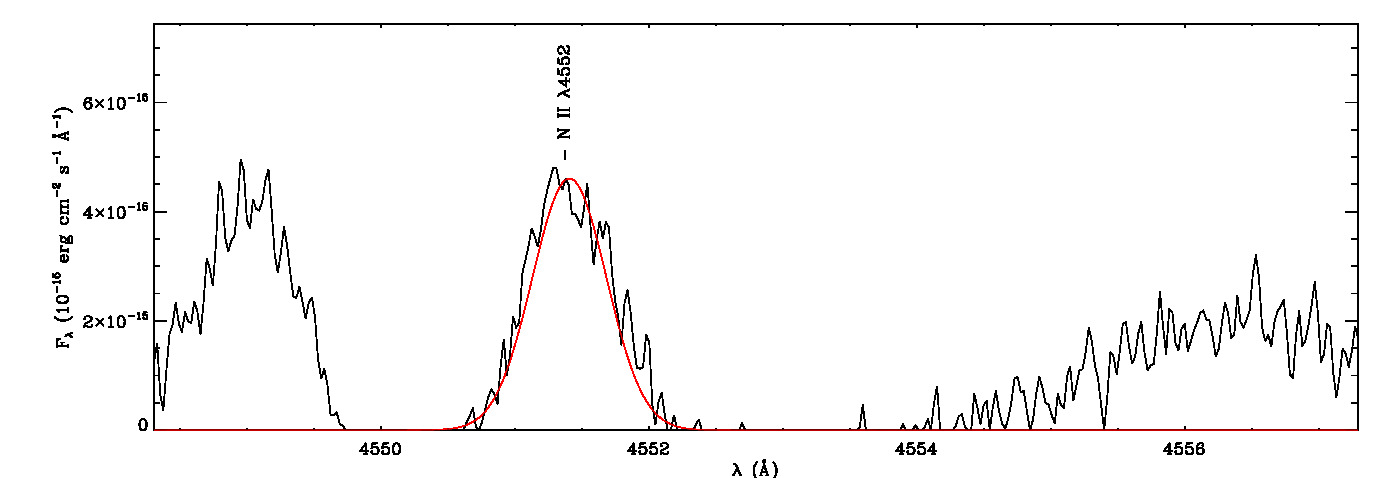
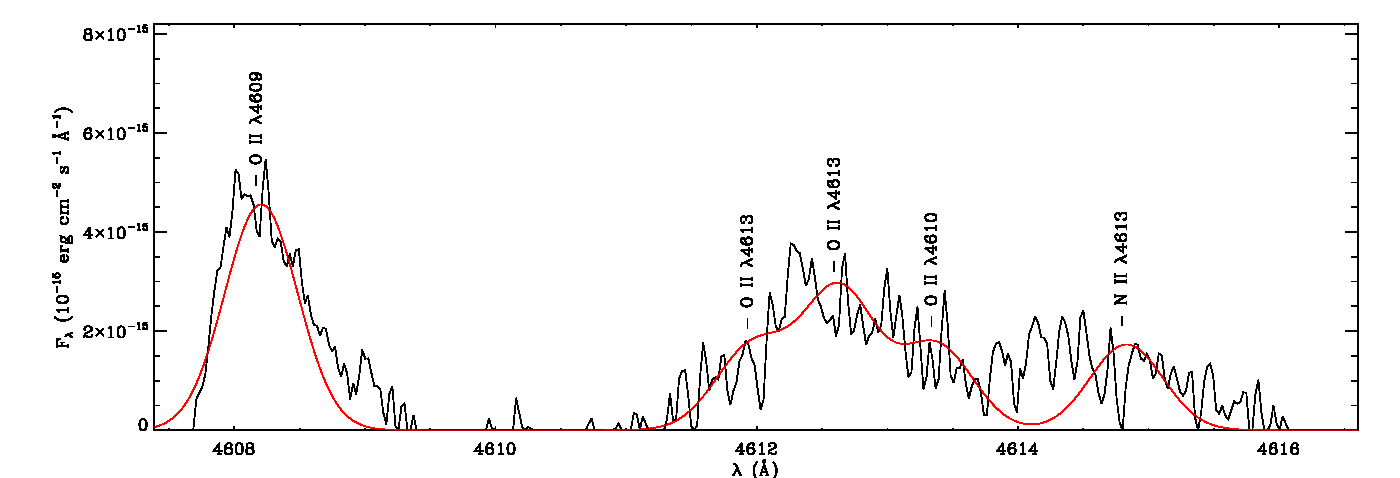
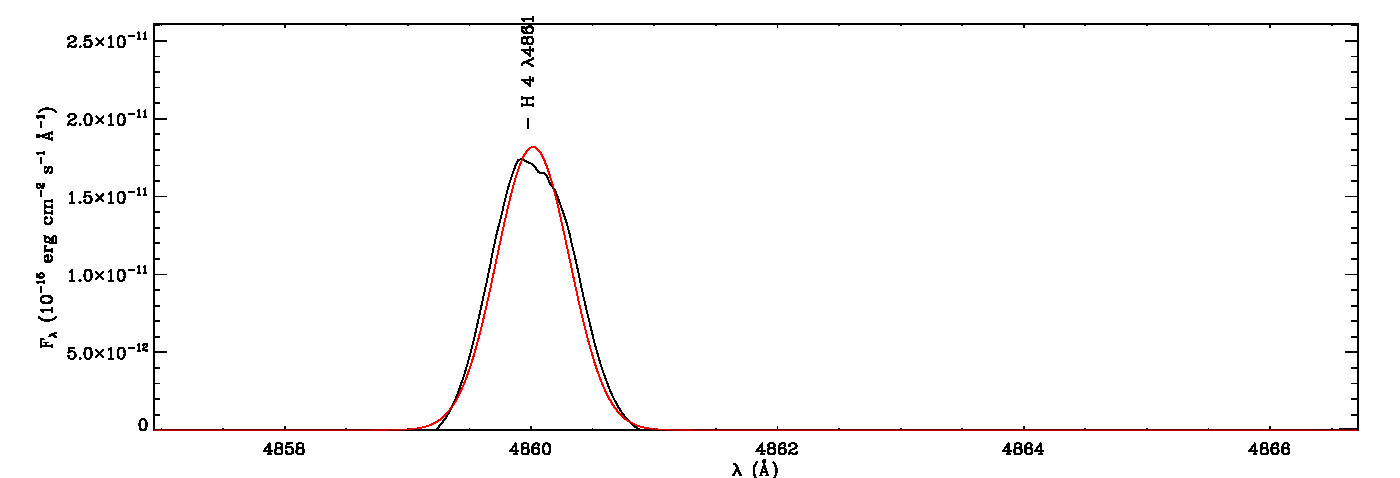
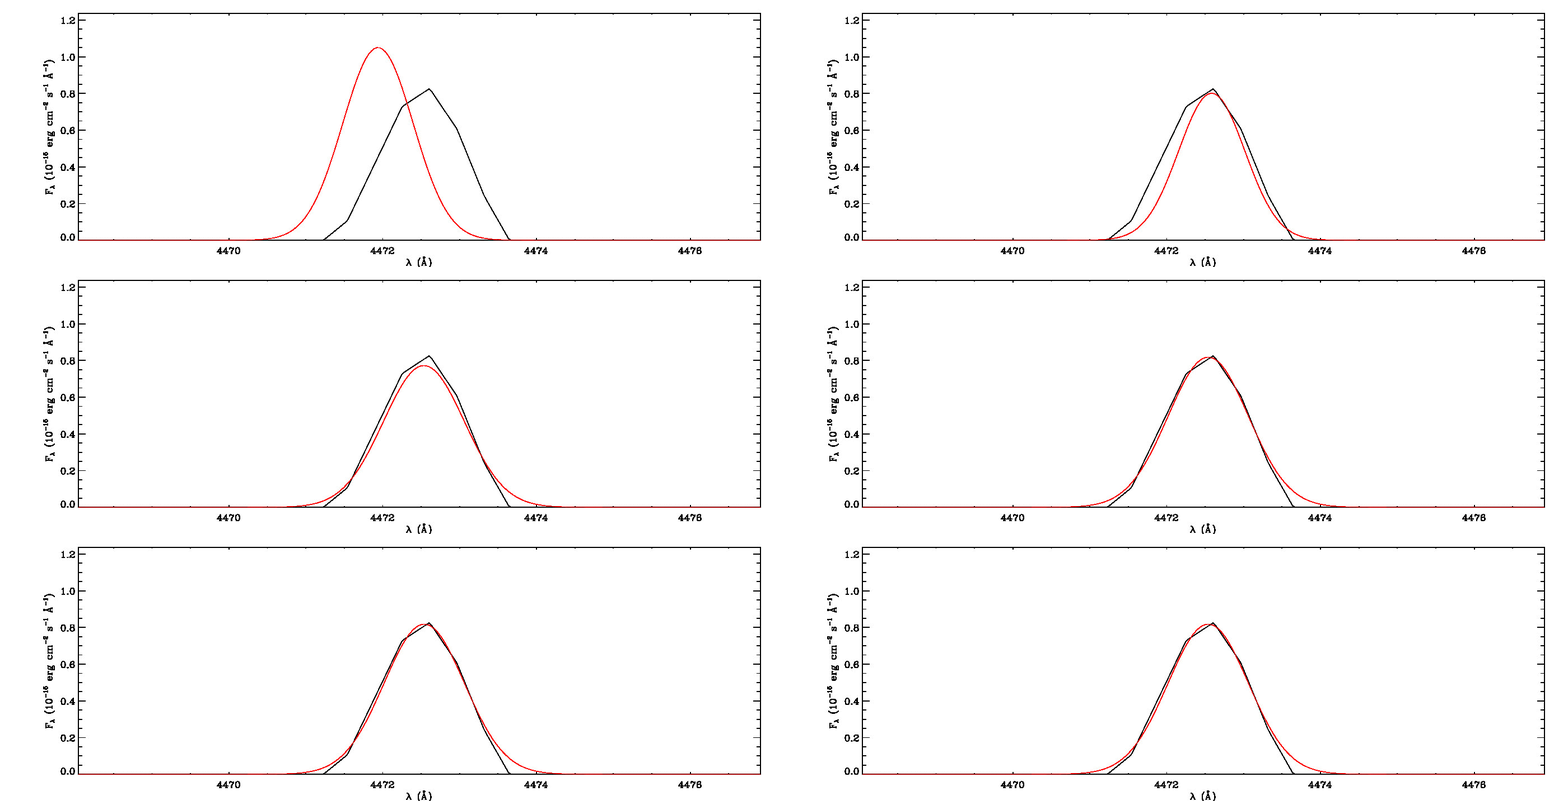
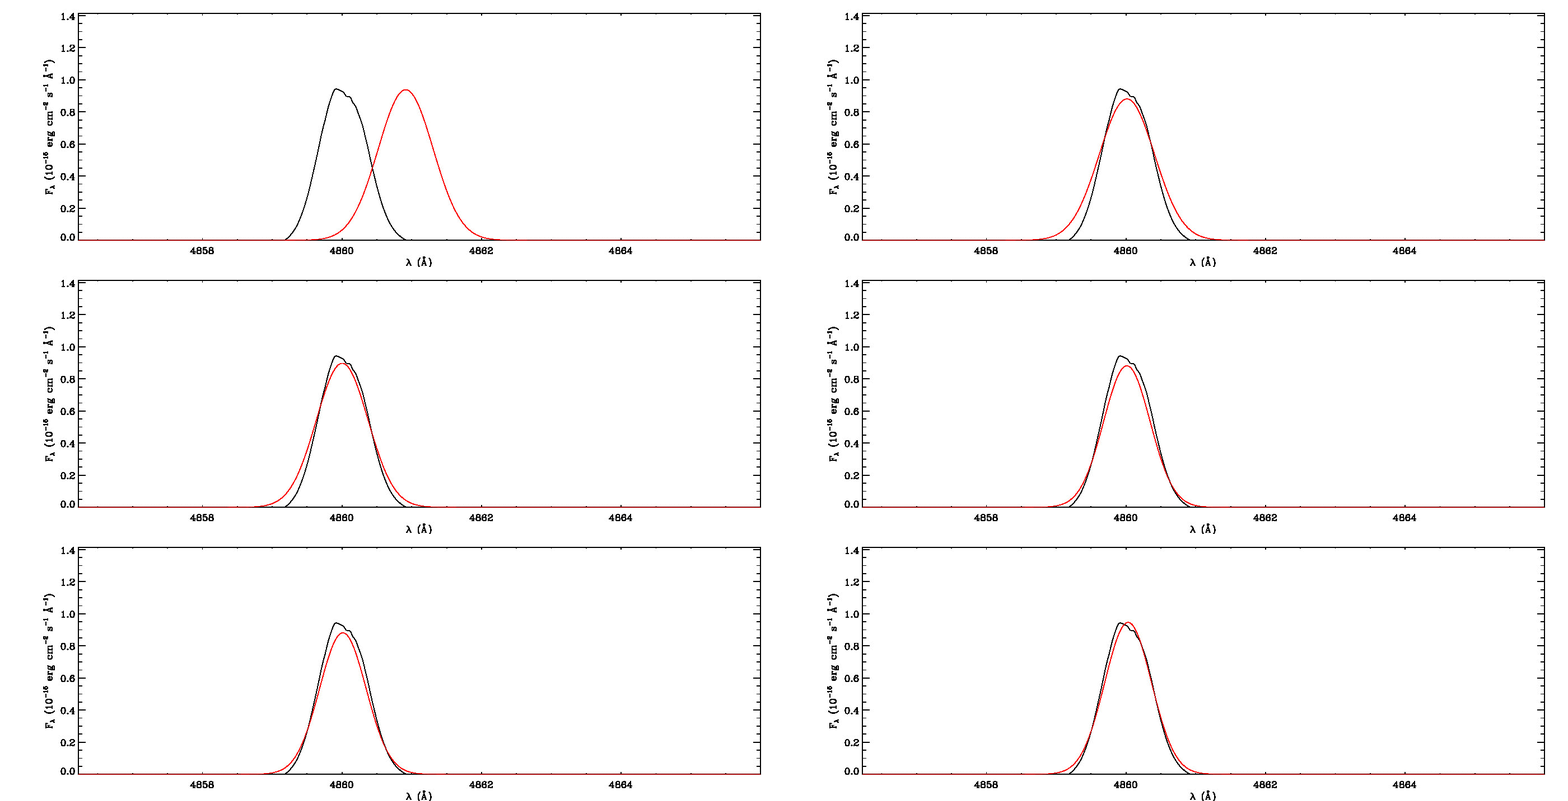
It will take a while to identify lines and fit Gaussian curves. You need to check the images of fitted lines stored in the image folder to remove some misidentified lines manually from the final list.
Notes
- To get better results, you should use a higher number of generations or/and a higher number of populations, which will increase the computational time, but will result in better fitted lines.
- You need to adjust the resolution parameters according to the spectral resolution of your observations.
- You need to change the redshift parameters for high redshift sources.
Documentation
For more information on how to use the API functions from the MGFIT-idl libray, please read the API Documentation published on mgfit.github.io/MGFIT-idl.